A Graph about cake
March 14, 2010
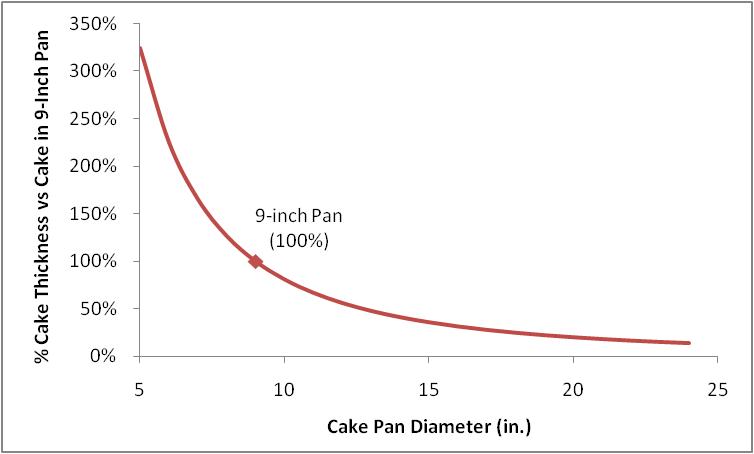 [caption id="attachment_341" align="alignleft" width="300" caption="A cake graph!"][/caption]
When I was building this cake, I had a small problem. The skillet that I used was somewhat smaller than what the recipe called for.
This happens a lot. So, I put together this graph in order to help me adjust the baking time correctly. Assuming that the recipe calls for a 9-inch pan, if you use a 10-inch pan instead, the cake will only be about 90% as thick, so you need to reduce the baking time somewhat. Similarly, if you use an 8-inch pan, the cake will be about 125% as thick, so you might need to increase the baking time.
It isn’t a strict guide by any means, but it could be a helpful extra piece of information to have when making recipe adjustments. The real thing to do would be to have a graph that shows the change in distance to the edge, from the most inner point of the cake.
For example, if I keep all things equal and use an 8-inch pan, I know the cake will be 125% as thick. But how far will the very interior of the cake be from the outside vs. a 9-inch pan? This seems to me to be the important variable for thinking about baking time adjustments. The entire cake has to be heated to a certain temperature - once that’s done, the cake’s done.
Update on discussing this with Lilli - I was right the first time. The diagonal distance to the side doesn’t matter, since the cake is being heated from all sides simultaneously. It’s only the minimum distance to the edge, which will be either the radius (if you were baking a ridiculously tall cake) or half the thickness. Anyway, if you’d like to download the Excel sheet I used to make this graph, click here.